
Dashboard functionalities
Welcome to your experience management dashboard
This guide walks you through the main features of the Experience Management Dashboard. Each part has been configured by your Admin to give you direct access to the most relevant insights.
If you have specific requests or would like adjustments, please consult your Admin or contact support for further options.
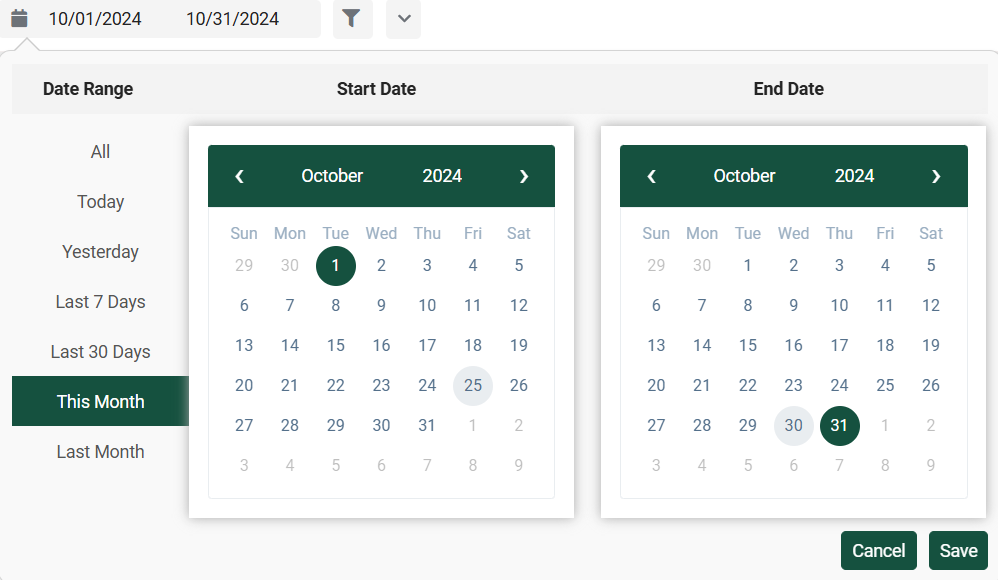
1. Calendar – select a date range for a global filter
The calendar feature allows you to select a date range that applies as a global filter across your dashboard. By choosing a specific time frame, you can narrow insights down to the most relevant periods, making it easy to spot trends and changes.
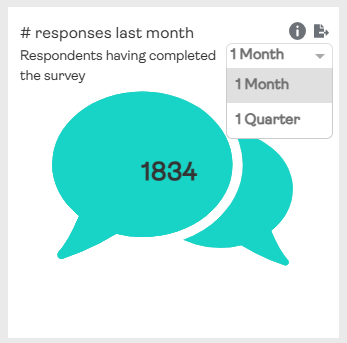
2. Periods in widgets – customize the displayed time periods
Each widget can be set to show a specific number of time periods, allowing you to compare insights over your preferred timeframe. Whether you want weekly, monthly, or yearly views, this option gives flexibility to analyze data at your chosen level.
3. Filters – refine data to focus on what matters
Filters are essential for zooming in on specific insights. You can easily set filters to adjust the data shown in each widget, such as filtering by department, region, or other relevant categories, depending on the options that your Admin made available.
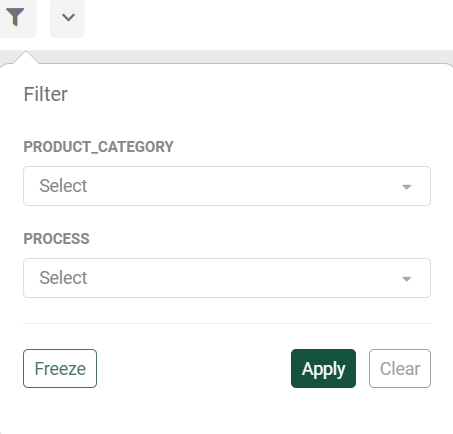
4. Filter freeze – save your preferred settings
With the filter freeze function, you can save a filter setup that suits your daily use. This way, you won’t have to re-select filters each time you log in. It’s especially useful if you frequently review similar data, saving you time and ensuring consistency.
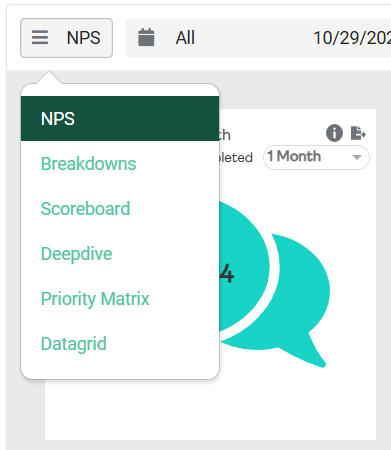
5. Tabs – organized insights for easy navigation
Tabs help structure insights across different areas. The tabs you see are set by your Admin, grouping related widgets and data to make navigating insights simple and intuitive. Each tab focuses on a specific aspect of your dashboard, like performance metrics or customer feedback.
6. Info button per widget – access detailed explanations
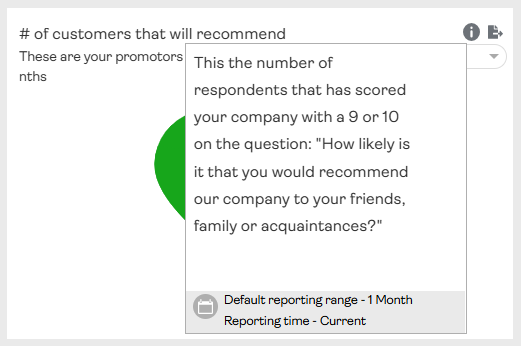
Each widget includes an info button where you’ll find additional details on the widget settings and the data presented. This feature is especially useful when you want to understand how specific metrics are calculated or how to interpret data within the widget.
7. Export per widget – download data for offline use
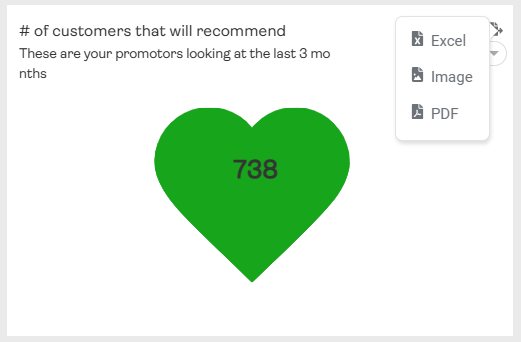
Need to share or analyze data offline? Use the export feature to download specific widgets. You can quickly generate a file with the data you need for presentations, reports, or further analysis.
8. User-specific settings – your preferences are saved automatically
The system remembers details specific to you, like your selected filters and periods, allowing you to pick up right where you left off each time you log in. This user-specific setup ensures your dashboard consistently reflects your preferences.